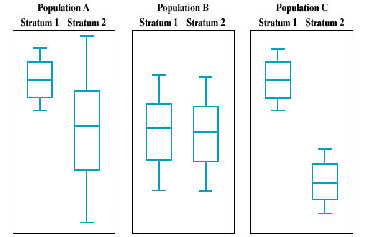
The following graphs are side-by-side boxplots of some variable for two strata in three hypothetical populations A, B, and C. In each population the units are evenly divided between the two strata.

Consider three sampling designs to estimate the true population mean (the total sample size is the same for all three designs):

  1. Simple random sampling
  2. Stratified random sampling taking equal sample sizes from the two strata
  3. stratified random sampling taking most units from one strata, but sampling a few units from the other strata


Let's Do It! 5.8 - Effective Sampling Design.

FEEDBACK


For which population will design (1) and (2) be comparably effective?
For which population will design (2) be the best?
For which population will design (3) be the best?