*** The information used here was obtained free of charge from and is copyrighted by Retrosheet. Interested parties may contact Retrosheet at 20 Sunset Rd., Newark, DE 19711. ***
~ Dedicated to my friend Joe, whose passion for this subject also goes back more than 25 years.
Top 150 Starting Pitcher Seasons, 1890-2024*. Min. ~4.40 StDevs over Avg.
{Playoff numbers included but not shown.}
| Rank |
Pitcher |
Year |
Team(s) |
LG
ERA |
DEF/
PFOPP |
OPP
WL |
IP
(as starter) |
Runs For-
Agst |
Won
(as starter) |
Lost
(as starter) |
ERA
(Adj. ERA) |
ERA Score |
# STDEV over Avg. |
ERA Rank (of 11,899) |
W-L Score |
# STDEV over Avg. |
W-L Rank (of 11,899) |
Total (ERA+
W-L STDEV) |
Avg. Rank) |
DEF/PFOPP is the degree by which the starter's E.R.A. was helped or hurt by his defense, park factors, runners left on base, and quality of opposing batters.
> 1.00 means it was more difficult for the starter and is beneficial to his adjusted ERA.
> The DEFENSE/PFOPP-adjusted E.R.A. is below the actual E.R.A.
PFOPP itself is a merging of Park Factors, game by game, where the pitcher started + the relative run-scoring ability of the OPPosing teams, game by game.
> 1.00 is beneficial to the pitcher's adjusted ERA.
OPPWL is the composite W-L record of the pitchers' opponents, in all of the games the opposing pitchers started that year. .
> .500 is beneficial to the pitcher's adjusted W% since it implies the starter faced above average run-scoring teams, or stronger than average opponents in general.
RUNS For/Agst is the total runs attributed for and against the starter, as pitcher of record.
This and other factors are used to determine expected W-L.
Note: Some of this data relies on play-by-play records. In cases where the play-by-play is not
available (mainly before 1912), full game log data is used and pro-rated using various criteria.
** As of this version, playoff game numbers have been incorporated, although not shown. Since all teams,
managers and players strive to win every game, playoff games are treated as any other game.
** Also as of this version, all seasons by a starter with at least 15 starts in the regular
seasons, and at least 100 IP (as a starter) are part of this analysis. This allows us to
incorporate even more of careers.
ALL 11,899 SEASONS, AS OF THROUGH 2024, ARE RANKED BY THEIR # OF STANDARD DEVIATIONS OVER OR UNDER AVERAGE. BUT, NON-QUALIFYING SEASONS WILL NOT BE SHOWN HERE. THERE ARE ROUGHLY AN EQUAL NUMBER OF POSITIVE (5791) AND NEGATIVE (6108) SEASONS.








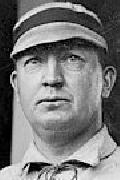

| 1 |
Walter Johnson |
1913
| Senators |
2.93 |
1.08 |
.525 |
346.00
(314.67) |
132-
66 |
36
(29) |
7
(7) |
1.14
(1.44) |
.820 |
3.36 |
11 |
.664 |
3.79 |
1 |
7.14 |
6.0 |
|---|
| 2 |
Pedro Martinez |
1999
| Red Sox |
4.86 |
1.07 |
.514 |
213.33
(208.34) |
137-
54 |
23
(22) |
4
(4) |
2.07
(2.32) |
.836 |
3.53 |
7 |
.643 |
3.28 |
5 |
6.82 |
6.0 |
|---|
| 3 |
Pedro Martinez |
2000
| Red Sox |
4.91 |
1.02 |
.496 |
217.00
(217) |
114-
43 |
18
(18) |
6
(6) |
1.74
(2.23) |
.831 |
3.47 |
9 |
.630 |
2.96 |
20 |
6.43 |
14.5 |
|---|
| 4 |
Greg Maddux |
1995
| Braves |
4.18 |
1.03 |
.513 |
209.67
(209.67) |
101-
37 |
19
(19) |
2
(2) |
1.63
(2.00) |
.795 |
3.07 |
24 |
.646 |
3.36 |
2 |
6.43 |
13.0 |
|---|
| 5 |
Randy Johnson |
1995
| Mariners |
4.71 |
1.01 |
.547 |
214.33
(214.33) |
122-
64 |
18
(18) |
2
(2) |
2.48
(2.26) |
.812 |
3.26 |
12 |
.636 |
3.12 |
9 |
6.38 |
10.5 |
|---|
| 6 |
Roger Clemens |
1997
| Blue Jays |
4.56 |
.98 |
.508 |
264.00
(264) |
146-
65 |
21
(21) |
7
(7) |
2.05
(2.13) |
.826 |
3.42 |
10 |
.628 |
2.92 |
21 |
6.35 |
15.5 |
|---|
| 7 |
Dwight Gooden |
1985
| Mets |
3.59 |
.96 |
.483 |
276.67
(276.67) |
138-
51 |
24
(24) |
4
(4) |
1.53
(1.87) |
.795 |
3.08 |
23 |
.636 |
3.11 |
11 |
6.19 |
17.0 |
|---|
| 8 |
Ron Guidry |
1978
| Yankees |
3.77 |
.95 |
.508 |
273.67
(273.67) |
154-
59 |
25
(25) |
3
(3) |
1.74
(2.14) |
.774 |
2.84 |
54 |
.646 |
3.34 |
3 |
6.18 |
28.5 |
|---|
| 9 |
Cy Young |
1901
| Red Sox |
3.66 |
.90 |
.462 |
371.33
(369) |
235-
115 |
33
(31) |
10
(10) |
1.62
(1.89) |
.811 |
3.26 |
13 |
.625 |
2.85 |
30 |
6.11 |
21.5 |
|---|
| 10 |
Lefty Grove |
1931
| Athletics |
4.38 |
.98 |
.469 |
288.67
(260.33) |
164-
73 |
31
(27) |
4
(3) |
2.06
(2.48) |
.768 |
2.77 |
61 |
.644 |
3.32 |
4 |
6.09 |
32.5 |
|---|
Top 150 Starting Pitcher Seasons, 1890-2024*. Min. ~4.40 StDevs over Avg.
| Rank |
Pitcher |
Year |
Team(s) |
LG
ERA |
DEF/
PFOPP |
OPP
WL |
IP
(as starter) |
Runs For-
Agst |
Won
(as starter) |
Lost
(as starter) |
ERA
(Adj. ERA) |
ERA Score |
# STDEV over Avg. |
ERA Rank (of 11,899) |
W-L Score |
# STDEV over Avg. |
W-L Rank (of 11,899) |
Total (ERA+
W-L STDEV) |
Avg. Rank) |
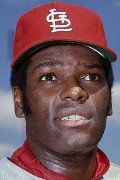




| 11 |
Bob Gibson |
1968
| Cardinals |
2.99 |
.89 |
.478 |
304.67
(304.67) |
100-
48 |
22
(22) |
9
(9) |
1.12
(1.50) |
.803 |
3.16 |
17 |
.627 |
2.88 |
27 |
6.04 |
22.0 |
|---|
| 12 |
Christy Mathewson |
1905
| Giants |
2.99 |
.93 |
.487 |
338.67
(333) |
191-
77 |
31
(29) |
9
(8) |
1.28
(1.78) |
.781 |
2.92 |
44 |
.636 |
3.12 |
10 |
6.03 |
27.0 |
|---|
| 13 |
Sandy Koufax |
1966
| Dodgers |
3.61 |
.92 |
.498 |
323.00
(323) |
151-
75 |
27
(27) |
9
(9) |
1.73
(1.88) |
.799 |
3.12 |
20 |
.628 |
2.91 |
24 |
6.03 |
22.0 |
|---|
| 14 |
Roger Clemens |
1990
| Red Sox |
3.91 |
1.05 |
.512 |
228.33
(228.34) |
114-
59 |
21
(21) |
6
(6) |
1.93
(1.87) |
.807 |
3.21 |
15 |
.622 |
2.78 |
40 |
5.99 |
27.5 |
|---|
| 15 |
Greg Maddux |
1997
| Braves |
4.20 |
.97 |
.515 |
232.67
(232.67) |
138-
58 |
19
(19) |
4
(4) |
2.20
(2.19) |
.801 |
3.14 |
19 |
.625 |
2.83 |
34 |
5.97 |
26.5 |
|---|
| 16 |
Zack Greinke |
2009
| Royals |
4.45 |
1.03 |
.508 |
229.33
(229.34) |
107-
64 |
16
(16) |
8
(8) |
2.16
(1.95) |
.841 |
3.59 |
6 |
.606 |
2.37 |
121 |
5.96 |
63.5 |
|---|
| 17 |
Greg Maddux |
1994
| Braves |
4.21 |
.98 |
.458 |
202.00
(202) |
95-
44 |
16
(16) |
6
(6) |
1.56
(1.87) |
.842 |
3.60 |
4 |
.604 |
2.32 |
137 |
5.92 |
70.5 |
|---|
| 18 |
Grover Alexander |
1915
| Phillies |
2.75 |
1.04 |
.469 |
376.33
(369) |
176-
83 |
31
(30) |
10
(9) |
1.22
(1.53) |
.781 |
2.91 |
45 |
.628 |
2.92 |
22 |
5.84 |
33.5 |
|---|
| 19 |
Dean Chance |
1964
| Angels |
3.63 |
.87 |
.494 |
278.33
(257.33) |
82-
48 |
20
(18) |
9
(8) |
1.65
(1.84) |
.804 |
3.17 |
16 |
.617 |
2.65 |
52 |
5.83 |
34.0 |
|---|
| 20 |
Pedro Martinez |
2002
| Red Sox |
4.46 |
.98 |
.510 |
199.33
(199.34) |
138-
63 |
20
(20) |
4
(4) |
2.26
(2.17) |
.808 |
3.23 |
14 |
.612 |
2.52 |
79 |
5.75 |
46.5 |
|---|
Top 150 Starting Pitcher Seasons, 1890-2024*. Min. ~4.40 StDevs over Avg.
| Rank |
Pitcher |
Year |
Team(s) |
LG
ERA |
DEF/
PFOPP |
OPP
WL |
IP
(as starter) |
Runs For-
Agst |
Won
(as starter) |
Lost
(as starter) |
ERA
(Adj. ERA) |
ERA Score |
# STDEV over Avg. |
ERA Rank (of 11,899) |
W-L Score |
# STDEV over Avg. |
W-L Rank (of 11,899) |
Total (ERA+
W-L STDEV) |
Avg. Rank) |





| 21 |
Christy Mathewson |
1908
| Giants |
2.35 |
.98 |
.497 |
390.67
(396) |
162-
87 |
37
(32) |
11
(10) |
1.43
(1.40) |
.757 |
2.65 |
83 |
.634 |
3.05 |
13 |
5.70 |
48.0 |
|---|
| 22 |
Randy Johnson |
2001
| Diamondbacks |
4.36 |
1.11 |
.471 |
249.67
(242.66) |
147-
74 |
21
(20) |
6
(6) |
2.49
(2.32) |
.797 |
3.10 |
22 |
.615 |
2.59 |
66 |
5.69 |
44.0 |
|---|
| 23 |
Lefty Grove |
1930
| Athletics |
4.65 |
.92 |
.500 |
291.00
(250.67) |
200-
90 |
28
(23) |
5
(3) |
2.54
(2.66) |
.773 |
2.84 |
55 |
.625 |
2.85 |
32 |
5.68 |
43.5 |
|---|
| 24 |
Jason Schmidt |
2003
| Giants |
4.28 |
.97 |
.527 |
207.67
(207.67) |
116-
55 |
17
(17) |
5
(5) |
2.34
(2.33) |
.787 |
2.98 |
34 |
.617 |
2.64 |
58 |
5.62 |
46.0 |
|---|
| 25 |
Pedro Martinez |
1997
| Expos |
4.20 |
1.04 |
.518 |
241.33
(241.33) |
95-
64 |
17
(17) |
8
(8) |
1.90
(2.12) |
.802 |
3.15 |
18 |
.609 |
2.44 |
99 |
5.59 |
58.5 |
|---|
| 26 |
Kevin Brown |
1998
| Padres |
4.23 |
.87 |
.562 |
257.00
(256) |
128-
77 |
18
(18) |
7
(7) |
2.38
(2.16) |
.789 |
3.01 |
29 |
.614 |
2.58 |
69 |
5.59 |
49.0 |
|---|
| 27 |
Christy Mathewson |
1909
| Giants |
2.59 |
1.03 |
.528 |
275.33
(297) |
121-
62 |
25
(23) |
6
(6) |
1.14
(1.52) |
.752 |
2.60 |
94 |
.631 |
2.98 |
16 |
5.59 |
55.0 |
|---|
| 28 |
Tom Seaver |
1971
| Mets |
3.47 |
.94 |
.510 |
286.33
(285.66) |
123-
56 |
20
(20) |
10
(9) |
1.76
(1.92) |
.774 |
2.84 |
52 |
.620 |
2.71 |
48 |
5.55 |
50.0 |
|---|
| 29 |
Clayton Kershaw |
2016
| Dodgers |
4.16 |
.90 |
.536 |
149.00
(149) |
75-
32 |
12
(12) |
4
(4) |
1.69
(1.65) |
.799 |
3.12 |
21 |
.606 |
2.39 |
112 |
5.51 |
66.5 |
|---|
| 30 |
Chris Sale |
2024
| Braves |
4.13 |
.97 |
.478 |
177.67
(177.67) |
126-
48 |
18
(18) |
3
(3) |
2.38
(2.10) |
.794 |
3.06 |
26 |
.607 |
2.41 |
108 |
5.47 |
67.0 |
|---|
Top 150 Starting Pitcher Seasons, 1890-2024*. Min. ~4.40 StDevs over Avg.
| Rank |
Pitcher |
Year |
Team(s) |
LG
ERA |
DEF/
PFOPP |
OPP
WL |
IP
(as starter) |
Runs For-
Agst |
Won
(as starter) |
Lost
(as starter) |
ERA
(Adj. ERA) |
ERA Score |
# STDEV over Avg. |
ERA Rank (of 11,899) |
W-L Score |
# STDEV over Avg. |
W-L Rank (of 11,899) |
Total (ERA+
W-L STDEV) |
Avg. Rank) |





| 31 |
Cliff Lee |
2008
| Indians |
4.35 |
.97 |
.493 |
223.33
(223.34) |
152-
67 |
22
(22) |
3
(3) |
2.54
(2.47) |
.760 |
2.68 |
75 |
.621 |
2.74 |
44 |
5.43 |
59.5 |
|---|
| 32 |
Zack Greinke |
2015
| Dodgers |
3.91 |
.96 |
.528 |
222.67
(222.66) |
101-
43 |
19
(19) |
3
(3) |
1.66
(2.34) |
.731 |
2.36 |
154 |
.633 |
3.04 |
14 |
5.40 |
84.0 |
|---|
| 33 |
Pedro Martinez |
2003
| Red Sox |
4.53 |
1.01 |
.530 |
186.67
(186.67) |
125-
52 |
14
(14) |
4
(4) |
2.22
(1.98) |
.785 |
2.96 |
36 |
.608 |
2.42 |
103 |
5.38 |
69.5 |
|---|
| 34 |
Cy Young |
1902
| Red Sox |
3.57 |
.94 |
.545 |
384.67
(387) |
237-
143 |
32
(32) |
11
(11) |
2.15
(2.19) |
.751 |
2.58 |
99 |
.622 |
2.78 |
42 |
5.36 |
70.5 |
|---|
| 35 |
Jake Arrieta |
2015
| Cubs |
3.91 |
.96 |
.516 |
229.00
(229) |
118-
53 |
22
(22) |
6
(6) |
1.77
(2.15) |
.750 |
2.58 |
101 |
.622 |
2.78 |
41 |
5.36 |
71.0 |
|---|
| 36 |
Gerrit Cole |
2019
| Astros |
4.60 |
1.03 |
.454 |
212.33
(212.33) |
177-
65 |
20
(20) |
5
(5) |
2.50
(2.50) |
.788 |
2.99 |
33 |
.605 |
2.36 |
123 |
5.35 |
78.0 |
|---|
| 37 |
Curt Schilling |
2001
| Diamondbacks |
4.36 |
1.08 |
.524 |
256.67
(256.66) |
154-
84 |
22
(22) |
6
(6) |
2.98
(2.93) |
.734 |
2.40 |
141 |
.628 |
2.92 |
23 |
5.32 |
82.0 |
|---|
| 38 |
Walter Johnson |
1915
| Senators |
2.94 |
1.04 |
.532 |
336.67
(328) |
146-
79 |
27
(25) |
13
(13) |
1.55
(1.81) |
.741 |
2.47 |
122 |
.625 |
2.84 |
33 |
5.31 |
77.5 |
|---|
| 39 |
Sandy Koufax |
1963
| Dodgers |
3.29 |
.94 |
.463 |
311.00
(311) |
144-
64 |
25
(25) |
5
(5) |
1.88
(2.06) |
.735 |
2.40 |
137 |
.627 |
2.90 |
26 |
5.31 |
81.5 |
|---|
| 40 |
Jacob deGrom |
2018
| Mets |
4.02 |
.87 |
.472 |
217.00
(217) |
86-
49 |
10
(10) |
9
(9) |
1.70
(1.70) |
.849 |
3.68 |
1 |
.575 |
1.63 |
698 |
5.30 |
349.5 |
|---|
Top 150 Starting Pitcher Seasons, 1890-2024*. Min. ~4.40 StDevs over Avg.
| Rank |
Pitcher |
Year |
Team(s) |
LG
ERA |
DEF/
PFOPP |
OPP
WL |
IP
(as starter) |
Runs For-
Agst |
Won
(as starter) |
Lost
(as starter) |
ERA
(Adj. ERA) |
ERA Score |
# STDEV over Avg. |
ERA Rank (of 11,899) |
W-L Score |
# STDEV over Avg. |
W-L Rank (of 11,899) |
Total (ERA+
W-L STDEV) |
Avg. Rank) |










| 41 |
Walter Johnson |
1912
| Senators |
3.34 |
.97 |
.468 |
369.00
(318) |
165-
80 |
33
(27) |
12
(10) |
1.39
(1.98) |
.759 |
2.67 |
79 |
.616 |
2.63 |
59 |
5.30 |
69.0 |
|---|
| 42 |
Sandy Koufax |
1964
| Dodgers |
3.54 |
.89 |
.541 |
223.00
(220) |
85-
46 |
19
(19) |
5
(5) |
1.74
(2.13) |
.738 |
2.45 |
127 |
.625 |
2.85 |
29 |
5.30 |
78.0 |
|---|
| 43 |
Jack Coombs |
1910
| Athletics |
2.53 |
.91 |
.494 |
353.00
(342) |
148-
65 |
31
(27) |
9
(8) |
1.30
(1.51) |
.718 |
2.22 |
203 |
.634 |
3.07 |
12 |
5.29 |
107.5 |
|---|
| 44 |
Blake Snell |
2018
| Rays |
4.27 |
.99 |
.503 |
180.67
(180.67) |
108-
41 |
21
(21) |
5
(5) |
1.89
(2.52) |
.742 |
2.48 |
119 |
.623 |
2.80 |
38 |
5.28 |
78.5 |
|---|
| 45 |
Steve Carlton |
1972
| Phillies |
3.46 |
.98 |
.501 |
346.33
(346.33) |
138-
83 |
27
(27) |
10
(10) |
1.97
(2.16) |
.736 |
2.42 |
133 |
.625 |
2.85 |
31 |
5.26 |
82.0 |
|---|
| 46 |
Kevin Brown |
1996
| Marlins |
4.21 |
.91 |
.518 |
233.00
(233) |
90-
58 |
17
(17) |
11
(11) |
1.89
(2.26) |
.781 |
2.92 |
42 |
.604 |
2.33 |
133 |
5.25 |
87.5 |
|---|
| 47 |
Mark Prior |
2003
| Cubs |
4.28 |
.99 |
.514 |
211.33
(211.34) |
114-
68 |
18
(18) |
6
(6) |
2.43
(2.23) |
.785 |
2.96 |
37 |
.601 |
2.27 |
161 |
5.23 |
99.0 |
|---|
| 48 |
Mordecai Brown |
1909
| Cubs |
2.59 |
.94 |
.527 |
342.67
(306) |
155-
73 |
27
(25) |
9
(8) |
1.31
(1.55) |
.754 |
2.61 |
92 |
.615 |
2.60 |
64 |
5.22 |
78.0 |
|---|
| 49 |
Bret Saberhagen |
1989
| Royals |
3.88 |
.93 |
.502 |
262.33
(260) |
141-
73 |
23
(23) |
6
(5) |
2.16
(2.25) |
.756 |
2.64 |
84 |
.614 |
2.57 |
70 |
5.21 |
77.0 |
|---|
| 50 |
Clayton Kershaw |
2014
| Dodgers |
3.66 |
.96 |
.514 |
198.33
(198.33) |
124-
43 |
21
(21) |
3
(3) |
1.77
(1.85) |
.734 |
2.40 |
140 |
.624 |
2.81 |
36 |
5.21 |
88.0 |
|---|
Top 150 Starting Pitcher Seasons, 1890-2024*. Min. ~4.40 StDevs over Avg.
| Rank |
Pitcher |
Year |
Team(s) |
LG
ERA |
DEF/
PFOPP |
OPP
WL |
IP
(as starter) |
Runs For-
Agst |
Won
(as starter) |
Lost
(as starter) |
ERA
(Adj. ERA) |
ERA Score |
# STDEV over Avg. |
ERA Rank (of 11,899) |
W-L Score |
# STDEV over Avg. |
W-L Rank (of 11,899) |
Total (ERA+
W-L STDEV) |
Avg. Rank) |
| 51 |
Hal Newhouser |
1946
| Tigers |
3.50 |
1.04 |
.464 |
292.67
(289) |
143-
73 |
26
(26) |
9
(8) |
1.94
(2.08) |
.751 |
2.58 |
100 |
.616 |
2.63 |
60 |
5.21 |
80.0 |
|---|
| 52 |
Roy Halladay |
2011
| Phillies |
3.81 |
1.00 |
.468 |
233.67
(233.67) |
125-
65 |
19
(19) |
6
(6) |
2.35
(1.98) |
.786 |
2.98 |
35 |
.600 |
2.22 |
185 |
5.20 |
110.0 |
|---|
| 53 |
Ed Walsh |
1908
| White Sox |
2.39 |
.87 |
.500 |
464.00
(441) |
162-
98 |
40
(35) |
15
(14) |
1.42
(1.59) |
.719 |
2.23 |
202 |
.630 |
2.96 |
19 |
5.19 |
110.5 |
|---|
| 54 |
Carl Hubbell |
1933
| Giants |
3.34 |
.94 |
.526 |
308.67
(274) |
89-
65 |
23
(20) |
12
(11) |
1.66
(2.02) |
.755 |
2.64 |
87 |
.613 |
2.56 |
74 |
5.19 |
80.5 |
|---|
| 55 |
Harry Brecheen |
1948
| Cardinals |
3.95 |
.96 |
.525 |
233.33
(228.67) |
115-
64 |
20
(20) |
7
(7) |
2.24
(2.26) |
.760 |
2.68 |
76 |
.611 |
2.50 |
83 |
5.19 |
79.5 |
|---|
| 56 |
Spud Chandler |
1943
| Yankees |
3.30 |
.93 |
.488 |
253.00
(253) |
113-
61 |
20
(20) |
4
(4) |
1.64
(2.00) |
.756 |
2.64 |
86 |
.613 |
2.54 |
76 |
5.18 |
81.0 |
|---|
| 57 |
Eddie Cicotte |
1919
| White Sox |
3.21 |
1.02 |
.526 |
306.67
(297.33) |
137-
76 |
29
(27) |
7
(6) |
1.82
(2.12) |
.699 |
2.01 |
327 |
.638 |
3.15 |
7 |
5.16 |
167.0 |
|---|
| 58 |
Randy Johnson |
2000
| Diamondbacks |
4.63 |
1.01 |
.487 |
248.67
(248.67) |
132-
88 |
19
(19) |
7
(7) |
2.64
(2.42) |
.791 |
3.03 |
28 |
.595 |
2.11 |
226 |
5.14 |
127.0 |
|---|
| 59 |
Nolan Ryan |
1981
| Astros |
3.49 |
.91 |
.546 |
149.00
(149) |
62-
34 |
11
(11) |
5
(5) |
1.69
(1.78) |
.795 |
3.07 |
25 |
.593 |
2.07 |
252 |
5.14 |
138.5 |
|---|
| 60 |
Lefty Gomez |
1937
| Yankees |
4.62 |
.97 |
.489 |
278.33
(278.33) |
176-
85 |
21
(21) |
11
(11) |
2.33
(2.70) |
.764 |
2.73 |
69 |
.607 |
2.41 |
106 |
5.14 |
87.5 |
|---|
Top 150 Starting Pitcher Seasons, 1890-2024*. Min. ~4.40 StDevs over Avg.
| Rank |
Pitcher |
Year |
Team(s) |
LG
ERA |
DEF/
PFOPP |
OPP
WL |
IP
(as starter) |
Runs For-
Agst |
Won
(as starter) |
Lost
(as starter) |
ERA
(Adj. ERA) |
ERA Score |
# STDEV over Avg. |
ERA Rank (of 11,899) |
W-L Score |
# STDEV over Avg. |
W-L Rank (of 11,899) |
Total (ERA+
W-L STDEV) |
Avg. Rank) |
| 61 |
Randy Johnson |
2002
| Diamondbacks |
4.11 |
1.10 |
.487 |
260.00
(260) |
173-
76 |
24
(24) |
5
(5) |
2.32
(2.37) |
.740 |
2.47 |
123 |
.617 |
2.65 |
55 |
5.12 |
89.0 |
|---|
| 62 |
Sandy Koufax |
1965
| Dodgers |
3.54 |
.88 |
.491 |
335.67
(333.67) |
138-
95 |
26
(26) |
8
(8) |
2.04
(2.24) |
.749 |
2.56 |
103 |
.612 |
2.53 |
78 |
5.09 |
90.5 |
|---|
| 63 |
Roger Clemens |
1998
| Blue Jays |
4.65 |
1.01 |
.462 |
234.67
(234.67) |
130-
78 |
20
(20) |
6
(6) |
2.65
(2.53) |
.776 |
2.87 |
50 |
.599 |
2.22 |
186 |
5.09 |
118.0 |
|---|
| 64 |
Carl Lundgren |
1907
| Cubs |
2.46 |
1.02 |
.526 |
207.00
(225) |
77-
51 |
18
(15) |
7
(7) |
1.17
(1.27) |
.791 |
3.03 |
27 |
.592 |
2.04 |
264 |
5.07 |
145.5 |
|---|
| 65 |
Walter Johnson |
1918
| Senators |
2.77 |
1.03 |
.512 |
326.00
(297) |
97-
63 |
23
(20) |
13
(9) |
1.27
(1.68) |
.749 |
2.57 |
102 |
.611 |
2.50 |
88 |
5.07 |
95.0 |
|---|
| 66 |
Warren Spahn |
1953
| Braves |
4.29 |
.90 |
.470 |
265.67
(260.34) |
142-
76 |
23
(23) |
7
(7) |
2.10
(2.45) |
.763 |
2.72 |
71 |
.604 |
2.34 |
127 |
5.06 |
99.0 |
|---|
| 67 |
Chris Carpenter |
2009
| Cardinals |
4.19 |
.95 |
.519 |
192.67
(192.67) |
105-
49 |
17
(17) |
4
(4) |
2.24
(2.32) |
.748 |
2.55 |
104 |
.611 |
2.50 |
85 |
5.06 |
94.5 |
|---|
| 68 |
Felix Hernandez |
2009
| Mariners |
4.45 |
.98 |
.537 |
238.67
(238.67) |
125-
81 |
19
(19) |
5
(5) |
2.49
(2.57) |
.756 |
2.64 |
85 |
.606 |
2.38 |
116 |
5.02 |
100.5 |
|---|
| 69 |
Bob Feller |
1946
| Indians |
3.50 |
.87 |
.589 |
371.33
(359) |
129-
94 |
26
(26) |
15
(15) |
2.18
(2.30) |
.716 |
2.20 |
219 |
.624 |
2.82 |
35 |
5.02 |
127.0 |
|---|
| 70 |
Dolf Luque |
1923
| Reds |
3.99 |
.95 |
.490 |
322.00
(309.33) |
153-
90 |
27
(26) |
8
(8) |
1.93
(2.55) |
.725 |
2.30 |
178 |
.619 |
2.70 |
50 |
4.99 |
114.0 |
|---|
Top 150 Starting Pitcher Seasons, 1890-2024*. Min. ~4.40 StDevs over Avg.
| Rank |
Pitcher |
Year |
Team(s) |
LG
ERA |
DEF/
PFOPP |
OPP
WL |
IP
(as starter) |
Runs For-
Agst |
Won
(as starter) |
Lost
(as starter) |
ERA
(Adj. ERA) |
ERA Score |
# STDEV over Avg. |
ERA Rank (of 11,899) |
W-L Score |
# STDEV over Avg. |
W-L Rank (of 11,899) |
Total (ERA+
W-L STDEV) |
Avg. Rank) |
| 71 |
Cy Young |
1892
| Cleveland |
3.28 |
.97 |
.506 |
453.00
(441) |
288-
148 |
36
(34) |
12
(11) |
1.93
(2.31) |
.693 |
1.95 |
361 |
.632 |
3.02 |
15 |
4.97 |
188.0 |
|---|
| 72 |
Carl Hubbell |
1936
| Giants |
4.02 |
1.00 |
.524 |
304.00
(290) |
135-
75 |
26
(24) |
6
(6) |
2.31
(2.86) |
.679 |
1.79 |
484 |
.638 |
3.16 |
6 |
4.95 |
245.0 |
|---|
| 73 |
Hyun-Jin Ryu |
2019
| Dodgers |
4.38 |
.97 |
.481 |
182.67
(182.66) |
113-
52 |
14
(14) |
5
(5) |
2.32
(2.29) |
.779 |
2.90 |
48 |
.590 |
2.00 |
282 |
4.90 |
165.0 |
|---|
| 74 |
Mordecai Brown |
1906
| Cubs |
2.63 |
.96 |
.518 |
277.33
(288) |
163-
66 |
26
(25) |
6
(6) |
1.04
(1.55) |
.717 |
2.20 |
217 |
.617 |
2.65 |
54 |
4.85 |
135.5 |
|---|
| 75 |
Dizzy Dean |
1934
| Cardinals |
4.06 |
1.10 |
.513 |
311.67
(280.67) |
177-
97 |
30
(26) |
7
(5) |
2.66
(2.90) |
.687 |
1.87 |
427 |
.631 |
2.98 |
17 |
4.85 |
222.0 |
|---|
| 76 |
Jack Taylor |
1902
| Cubs |
2.78 |
.92 |
.534 |
333.67
(306) |
129-
82 |
23
(21) |
11
(11) |
1.29
(1.62) |
.765 |
2.74 |
65 |
.595 |
2.11 |
230 |
4.85 |
147.5 |
|---|
| 77 |
Claude Hendrix |
1914
| Chicago |
3.20 |
.86 |
.521 |
362.00
(328) |
164-
82 |
29
(26) |
10
(9) |
1.69
(2.10) |
.717 |
2.20 |
216 |
.617 |
2.64 |
57 |
4.85 |
136.5 |
|---|
| 78 |
Jake Peavy |
2007
| Padres |
4.43 |
.82 |
.503 |
223.33
(223.33) |
145-
63 |
19
(19) |
6
(6) |
2.54
(2.57) |
.752 |
2.59 |
96 |
.600 |
2.23 |
179 |
4.83 |
137.5 |
|---|
| 79 |
John Smoltz |
1996
| Braves |
4.21 |
1.06 |
.532 |
253.67
(253.67) |
160-
95 |
24
(24) |
8
(8) |
2.94
(2.86) |
.725 |
2.29 |
179 |
.612 |
2.52 |
80 |
4.82 |
129.5 |
|---|
| 80 |
Walter Johnson |
1910
| Senators |
2.53 |
.97 |
.501 |
370.00
(378) |
162-
96 |
25
(24) |
17
(16) |
1.36
(1.47) |
.767 |
2.76 |
64 |
.592 |
2.04 |
261 |
4.80 |
162.5 |
|---|
Top 150 Starting Pitcher Seasons, 1890-2024*. Min. ~4.40 StDevs over Avg.
| Rank |
Pitcher |
Year |
Team(s) |
LG
ERA |
DEF/
PFOPP |
OPP
WL |
IP
(as starter) |
Runs For-
Agst |
Won
(as starter) |
Lost
(as starter) |
ERA
(Adj. ERA) |
ERA Score |
# STDEV over Avg. |
ERA Rank (of 11,899) |
W-L Score |
# STDEV over Avg. |
W-L Rank (of 11,899) |
Total (ERA+
W-L STDEV) |
Avg. Rank) |
| 81 |
Dutch Leonard 1 |
1914
| Red Sox |
2.73 |
.94 |
.468 |
224.67
(198.67) |
94-
34 |
19
(15) |
5
(5) |
.96
(1.58) |
.755 |
2.63 |
89 |
.597 |
2.17 |
198 |
4.80 |
143.5 |
|---|
| 82 |
Rube Waddell |
1905
| Athletics |
2.65 |
1.02 |
.475 |
328.67
(306) |
135-
87 |
27
(19) |
10
(10) |
1.48
(1.43) |
.789 |
3.01 |
30 |
.582 |
1.79 |
486 |
4.80 |
258.0 |
|---|
| 83 |
Justin Verlander |
2022
| Astros |
3.88 |
.98 |
.507 |
175.00
(175) |
89-
43 |
18
(18) |
4
(4) |
1.75
(1.97) |
.728 |
2.33 |
167 |
.610 |
2.47 |
93 |
4.80 |
130.0 |
|---|
| 84 |
Mordecai Brown |
1908
| Cubs |
2.35 |
1.06 |
.526 |
312.33
(279) |
109-
59 |
29
(23) |
9
(8) |
1.47
(1.66) |
.692 |
1.92 |
382 |
.626 |
2.87 |
28 |
4.79 |
205.0 |
|---|
| 85 |
Smokey Joe Wood |
1912
| Red Sox |
3.34 |
1.01 |
.478 |
344.00
(334.33) |
213-
98 |
34
(33) |
5
(5) |
1.91
(2.31) |
.667 |
1.65 |
638 |
.637 |
3.13 |
8 |
4.79 |
323.0 |
|---|
| 86 |
Wilbur Wood |
1971
| White Sox |
3.47 |
.96 |
.539 |
334.00
(332) |
137-
91 |
22
(22) |
13
(13) |
1.91
(2.04) |
.758 |
2.66 |
80 |
.595 |
2.12 |
220 |
4.79 |
150.0 |
|---|
| 87 |
Orval Overall |
1909
| Cubs |
2.59 |
.91 |
.530 |
285.00
(288) |
116-
70 |
20
(19) |
11
(11) |
1.42
(1.48) |
.764 |
2.73 |
67 |
.592 |
2.04 |
260 |
4.78 |
163.5 |
|---|
| 88 |
Tarik Skubal |
2024
| Tigers |
4.01 |
1.01 |
.498 |
192.00
(192) |
134-
56 |
18
(18) |
4
(4) |
2.39
(2.36) |
.742 |
2.49 |
116 |
.602 |
2.28 |
156 |
4.77 |
136.0 |
|---|
| 89 |
Mike Garcia |
1949
| Indians |
4.20 |
.96 |
.545 |
175.67
(137) |
59-
38 |
14
(11) |
5
(4) |
2.36
(2.40) |
.754 |
2.62 |
91 |
.597 |
2.15 |
207 |
4.77 |
149.0 |
|---|
| 90 |
Dazzy Vance |
1924
| Dodgers |
3.87 |
.98 |
.488 |
308.33
(304) |
160-
87 |
28
(27) |
6
(6) |
2.16
(2.65) |
.693 |
1.94 |
365 |
.623 |
2.81 |
37 |
4.75 |
201.0 |
|---|
Top 150 Starting Pitcher Seasons, 1890-2024*. Min. ~4.40 StDevs over Avg.
| Rank |
Pitcher |
Year |
Team(s) |
LG
ERA |
DEF/
PFOPP |
OPP
WL |
IP
(as starter) |
Runs For-
Agst |
Won
(as starter) |
Lost
(as starter) |
ERA
(Adj. ERA) |
ERA Score |
# STDEV over Avg. |
ERA Rank (of 11,899) |
W-L Score |
# STDEV over Avg. |
W-L Rank (of 11,899) |
Total (ERA+
W-L STDEV) |
Avg. Rank) |
| 91 |
Christy Mathewson |
1911
| Giants |
3.39 |
.96 |
.495 |
307.00
(333) |
185-
113 |
26
(24) |
13
(13) |
1.99
(1.91) |
.769 |
2.78 |
58 |
.589 |
1.96 |
315 |
4.74 |
186.5 |
|---|
| 92 |
Tom Seaver |
1973
| Mets |
3.67 |
1.01 |
.502 |
290.00
(290) |
129-
74 |
19
(19) |
10
(10) |
2.08
(2.31) |
.730 |
2.35 |
159 |
.606 |
2.38 |
115 |
4.73 |
137.0 |
|---|
| 93 |
Lefty Gomez |
1934
| Yankees |
4.40 |
.90 |
.452 |
281.67
(275.33) |
184-
81 |
26
(25) |
5
(3) |
2.33
(2.99) |
.705 |
2.07 |
280 |
.617 |
2.65 |
53 |
4.73 |
166.5 |
|---|
| 94 |
Amos Rusie |
1894
| Giants |
5.33 |
.91 |
.500 |
444.00
(450) |
322-
239 |
36
(34) |
13
(12) |
2.78
(3.63) |
.711 |
2.14 |
244 |
.614 |
2.59 |
67 |
4.73 |
155.5 |
|---|
| 95 |
Blake Snell |
2023
| Padres |
4.38 |
.99 |
.461 |
180.00
(180) |
92-
47 |
14
(14) |
9
(9) |
2.25
(2.35) |
.776 |
2.86 |
51 |
.585 |
1.86 |
388 |
4.73 |
219.5 |
|---|
| 96 |
Dazzy Vance |
1928
| Dodgers |
3.98 |
.95 |
.490 |
280.33
(274.67) |
122-
78 |
22
(21) |
10
(9) |
2.09
(2.48) |
.732 |
2.37 |
149 |
.605 |
2.35 |
125 |
4.71 |
137.0 |
|---|
| 97 |
Gaylord Perry |
1972
| Indians |
3.07 |
1.08 |
.552 |
342.67
(341.66) |
114-
77 |
24
(24) |
16
(16) |
1.92
(2.09) |
.699 |
2.01 |
329 |
.619 |
2.71 |
49 |
4.71 |
189.0 |
|---|
| 98 |
Jake Peavy |
2004
| Padres |
4.31 |
.94 |
.537 |
166.33
(166.33) |
119-
48 |
15
(15) |
6
(6) |
2.27
(2.42) |
.759 |
2.67 |
78 |
.592 |
2.04 |
263 |
4.71 |
170.5 |
|---|
| 99 |
Walter Johnson |
1919
| Senators |
3.21 |
.96 |
.461 |
290.33
(269.33) |
106-
65 |
20
(18) |
14
(10) |
1.49
(1.85) |
.764 |
2.73 |
68 |
.589 |
1.98 |
303 |
4.71 |
185.5 |
|---|
| 100 |
Tim Lincecum |
2009
| Giants |
4.19 |
1.04 |
.523 |
225.33
(225.33) |
115-
68 |
15
(15) |
7
(7) |
2.48
(2.40) |
.757 |
2.66 |
82 |
.591 |
2.03 |
267 |
4.68 |
174.5 |
|---|
Top 150 Starting Pitcher Seasons, 1890-2024*. Min. ~4.40 StDevs over Avg.
| Rank |
Pitcher |
Year |
Team(s) |
LG
ERA |
DEF/
PFOPP |
OPP
WL |
IP
(as starter) |
Runs For-
Agst |
Won
(as starter) |
Lost
(as starter) |
ERA
(Adj. ERA) |
ERA Score |
# STDEV over Avg. |
ERA Rank (of 11,899) |
W-L Score |
# STDEV over Avg. |
W-L Rank (of 11,899) |
Total (ERA+
W-L STDEV) |
Avg. Rank) |
| 101 |
Cy Young |
1895
| Cleveland |
4.77 |
.88 |
.498 |
369.67
(360) |
244-
169 |
35
(33) |
10
(9) |
3.26
(3.39) |
.688 |
1.88 |
418 |
.623 |
2.80 |
39 |
4.68 |
228.5 |
|---|
| 102 |
Kevin Brown |
2000
| Dodgers |
4.63 |
.94 |
.525 |
230.00
(230) |
127-
74 |
13
(13) |
6
(6) |
2.58
(2.58) |
.767 |
2.76 |
63 |
.587 |
1.91 |
354 |
4.67 |
208.5 |
|---|
| 103 |
Corey Kluber |
2017
| Indians |
4.37 |
.97 |
.485 |
203.67
(203.67) |
118-
56 |
18
(18) |
4
(4) |
2.25
(2.37) |
.730 |
2.35 |
158 |
.603 |
2.32 |
138 |
4.67 |
148.0 |
|---|
| 104 |
Josh Beckett |
2007
| Red Sox |
4.40 |
1.11 |
.522 |
200.67
(200.67) |
147-
76 |
20
(20) |
7
(7) |
3.27
(3.00) |
.725 |
2.30 |
177 |
.605 |
2.36 |
122 |
4.66 |
149.5 |
|---|
| 105 |
Greg Maddux |
1998
| Braves |
4.23 |
.99 |
.474 |
251.00
(251) |
138-
74 |
18
(18) |
9
(9) |
2.22
(2.41) |
.758 |
2.66 |
81 |
.590 |
2.00 |
284 |
4.66 |
182.5 |
|---|
| 106 |
Billy Rhines |
1890
| Reds |
3.56 |
1.01 |
.569 |
401.33
(405) |
211-
161 |
28
(26) |
17
(16) |
1.95
(2.40) |
.713 |
2.16 |
231 |
.610 |
2.48 |
92 |
4.64 |
161.5 |
|---|
| 107 |
Roy Halladay |
2010
| Phillies |
4.02 |
1.01 |
.501 |
250.67
(243.67) |
129-
73 |
21
(21) |
10
(10) |
2.44
(2.45) |
.734 |
2.40 |
139 |
.600 |
2.24 |
174 |
4.64 |
156.5 |
|---|
| 108 |
Rube Waddell |
1902
| Athletics |
3.57 |
1.00 |
.527 |
276.33
(243) |
131-
91 |
24
(19) |
7
(7) |
2.05
(2.17) |
.744 |
2.51 |
112 |
.595 |
2.12 |
217 |
4.64 |
164.5 |
|---|
| 109 |
Kid Nichols |
1897
| Braves |
4.30 |
.99 |
.525 |
368.00
(360) |
286-
155 |
31
(29) |
11
(10) |
2.64
(2.96) |
.700 |
2.02 |
320 |
.615 |
2.61 |
63 |
4.63 |
191.5 |
|---|
| 110 |
Randy Johnson |
1997
| Mariners |
4.56 |
.99 |
.480 |
213.00
(211) |
113-
60 |
20
(19) |
4
(4) |
2.28
(2.76) |
.713 |
2.16 |
232 |
.609 |
2.46 |
96 |
4.62 |
164.0 |
|---|
Top 150 Starting Pitcher Seasons, 1890-2024*. Min. ~4.40 StDevs over Avg.
| Rank |
Pitcher |
Year |
Team(s) |
LG
ERA |
DEF/
PFOPP |
OPP
WL |
IP
(as starter) |
Runs For-
Agst |
Won
(as starter) |
Lost
(as starter) |
ERA
(Adj. ERA) |
ERA Score |
# STDEV over Avg. |
ERA Rank (of 11,899) |
W-L Score |
# STDEV over Avg. |
W-L Rank (of 11,899) |
Total (ERA+
W-L STDEV) |
Avg. Rank) |
| 111 |
Clark Griffith |
1898
| Cubs |
3.60 |
.97 |
.555 |
325.67
(342) |
207-
113 |
24
(23) |
10
(9) |
1.88
(2.39) |
.709 |
2.12 |
254 |
.611 |
2.50 |
90 |
4.62 |
172.0 |
|---|
| 112 |
Roy Halladay |
2009
| Blue Jays |
4.45 |
.99 |
.552 |
239.00
(239) |
150-
82 |
17
(17) |
10
(10) |
2.79
(2.57) |
.755 |
2.63 |
88 |
.590 |
1.98 |
301 |
4.61 |
194.5 |
|---|
| 113 |
Trevor Bauer |
2018
| Indians |
4.27 |
1.02 |
.485 |
175.33
(171.33) |
97-
50 |
12
(12) |
6
(6) |
2.21
(2.15) |
.781 |
2.92 |
41 |
.578 |
1.69 |
607 |
4.61 |
324.0 |
|---|
| 114 |
Stephen Strasburg |
2017
| Nationals |
4.34 |
1.01 |
.468 |
175.33
(175.34) |
98-
54 |
15
(15) |
4
(4) |
2.52
(2.68) |
.751 |
2.59 |
98 |
.591 |
2.01 |
275 |
4.60 |
186.5 |
|---|
| 115 |
Lefty Grove |
1939
| Red Sox |
4.62 |
1.06 |
.530 |
191.00
(191) |
110-
61 |
15
(15) |
4
(4) |
2.54
(2.93) |
.717 |
2.21 |
214 |
.606 |
2.39 |
111 |
4.60 |
162.5 |
|---|
| 116 |
Clayton Kershaw |
2015
| Dodgers |
3.91 |
.97 |
.518 |
232.67
(232.66) |
115-
65 |
16
(16) |
7
(7) |
2.13
(2.25) |
.752 |
2.59 |
97 |
.590 |
2.00 |
285 |
4.59 |
191.0 |
|---|
| 117 |
Vida Blue |
1971
| Athletics |
3.47 |
.97 |
.499 |
312.00
(312) |
136-
71 |
24
(24) |
8
(8) |
1.82
(2.27) |
.695 |
1.97 |
351 |
.615 |
2.61 |
62 |
4.58 |
206.5 |
|---|
| 118 |
Walter Johnson |
1911
| Senators |
3.34 |
.97 |
.506 |
322.33
(333) |
178-
123 |
25
(24) |
13
(12) |
1.90
(1.93) |
.765 |
2.74 |
66 |
.583 |
1.83 |
432 |
4.57 |
249.0 |
|---|
| 119 |
Robin Roberts |
1952
| Phillies |
3.73 |
1.00 |
.498 |
330.00
(327) |
182-
104 |
28
(28) |
7
(7) |
2.59
(2.54) |
.698 |
2.00 |
333 |
.613 |
2.56 |
73 |
4.55 |
203.0 |
|---|
| 120 |
Randy Johnson |
2004
| Diamondbacks |
4.31 |
1.06 |
.537 |
245.67
(245.67) |
109-
87 |
16
(16) |
14
(14) |
2.60
(2.33) |
.780 |
2.91 |
47 |
.575 |
1.64 |
680 |
4.55 |
363.5 |
|---|
Top 150 Starting Pitcher Seasons, 1890-2024*. Min. ~4.40 StDevs over Avg.
| Rank |
Pitcher |
Year |
Team(s) |
LG
ERA |
DEF/
PFOPP |
OPP
WL |
IP
(as starter) |
Runs For-
Agst |
Won
(as starter) |
Lost
(as starter) |
ERA
(Adj. ERA) |
ERA Score |
# STDEV over Avg. |
ERA Rank (of 11,899) |
W-L Score |
# STDEV over Avg. |
W-L Rank (of 11,899) |
Total (ERA+
W-L STDEV) |
Avg. Rank) |
| 121 |
Juan Marichal |
1969
| Giants |
3.60 |
.98 |
.525 |
299.67
(298.67) |
117-
88 |
21
(21) |
11
(11) |
2.10
(2.19) |
.742 |
2.48 |
118 |
.593 |
2.06 |
254 |
4.55 |
186.0 |
|---|
| 122 |
Ewell Blackwell |
1947
| Reds |
4.07 |
.90 |
.555 |
273.00
(273) |
137-
90 |
22
(22) |
8
(8) |
2.47
(2.61) |
.718 |
2.22 |
204 |
.603 |
2.31 |
143 |
4.54 |
173.5 |
|---|
| 123 |
Lefty Grove |
1932
| Athletics |
4.48 |
1.14 |
.479 |
291.67
(258) |
182-
91 |
25
(22) |
10
(8) |
2.84
(2.94) |
.711 |
2.14 |
242 |
.606 |
2.39 |
114 |
4.53 |
178.0 |
|---|
| 124 |
Noah Syndergaard |
2016
| Mets |
4.16 |
.99 |
.482 |
183.67
(182.66) |
97-
59 |
14
(14) |
9
(9) |
2.60
(2.27) |
.783 |
2.94 |
40 |
.573 |
1.59 |
739 |
4.52 |
389.5 |
|---|
| 125 |
Steve Carlton |
1980
| Phillies |
3.60 |
1.08 |
.486 |
304.00
(304) |
156-
87 |
24
(24) |
9
(9) |
2.34
(2.39) |
.705 |
2.07 |
281 |
.609 |
2.45 |
97 |
4.52 |
189.0 |
|---|
| 126 |
Josh Johnson |
2010
| Marlins |
4.02 |
1.03 |
.505 |
183.67
(183.66) |
100-
53 |
11
(11) |
6
(6) |
2.30
(2.17) |
.774 |
2.84 |
53 |
.577 |
1.67 |
623 |
4.51 |
338.0 |
|---|
| 127 |
Kid Nichols |
1898
| Braves |
3.60 |
1.04 |
.521 |
388.00
(387) |
236-
138 |
31
(29) |
12
(11) |
2.13
(2.55) |
.685 |
1.85 |
442 |
.617 |
2.65 |
56 |
4.40 |
249.0 |
|---|
| 128 |
Shohei Ohtani |
2022
| Angels |
3.88 |
1.05 |
.538 |
166.00
(166) |
79-
45 |
15
(15) |
9
(9) |
2.33
(2.34) |
.732 |
2.37 |
147 |
.595 |
2.11 |
229 |
4.48 |
188.0 |
|---|
| 129 |
Grover Alexander |
1917
| Phillies |
2.70 |
1.06 |
.494 |
388.00
(386) |
164-
108 |
30
(30) |
13
(13) |
1.83
(1.81) |
.711 |
2.14 |
245 |
.604 |
2.34 |
128 |
4.48 |
186.5 |
|---|
| 130 |
Christy Mathewson |
1912
| Giants |
3.40 |
1.00 |
.484 |
310.00
(288.33) |
178-
101 |
23
(21) |
12
(10) |
2.12
(2.11) |
.752 |
2.59 |
95 |
.585 |
1.88 |
378 |
4.47 |
236.5 |
|---|
Top 150 Starting Pitcher Seasons, 1890-2024*. Min. ~4.40 StDevs over Avg.
| Rank |
Pitcher |
Year |
Team(s) |
LG
ERA |
DEF/
PFOPP |
OPP
WL |
IP
(as starter) |
Runs For-
Agst |
Won
(as starter) |
Lost
(as starter) |
ERA
(Adj. ERA) |
ERA Score |
# STDEV over Avg. |
ERA Rank (of 11,899) |
W-L Score |
# STDEV over Avg. |
W-L Rank (of 11,899) |
Total (ERA+
W-L STDEV) |
Avg. Rank) |
| 131 |
Roger Clemens |
1986
| Red Sox |
4.18 |
.98 |
.506 |
254.00
(254) |
178-
76 |
24
(24) |
4
(4) |
2.48
(2.83) |
.672 |
1.70 |
574 |
.622 |
2.76 |
43 |
4.47 |
308.5 |
|---|
| 132 |
Mel Parnell |
1949
| Red Sox |
4.20 |
1.04 |
.539 |
295.33
(285.67) |
190-
94 |
25
(24) |
7
(6) |
2.77
(2.99) |
.676 |
1.75 |
523 |
.620 |
2.71 |
47 |
4.46 |
285.0 |
|---|
| 133 |
Roy Halladay |
2002
| Blue Jays |
4.46 |
1.00 |
.504 |
239.33
(239.33) |
158-
93 |
19
(19) |
7
(7) |
2.93
(2.59) |
.753 |
2.61 |
93 |
.584 |
1.85 |
403 |
4.46 |
248.0 |
|---|
| 134 |
Jim Palmer |
1975
| Orioles |
3.79 |
.89 |
.485 |
323.00
(322.34) |
146-
83 |
23
(23) |
11
(11) |
2.09
(2.48) |
.714 |
2.17 |
228 |
.602 |
2.29 |
153 |
4.46 |
190.5 |
|---|
| 135 |
Johan Santana |
2006
| Twins |
4.56 |
.99 |
.505 |
233.67
(233.67) |
131-
80 |
19
(19) |
6
(6) |
2.77
(2.92) |
.717 |
2.21 |
215 |
.601 |
2.25 |
169 |
4.46 |
192.0 |
|---|
| 136 |
Mike Scott |
1986
| Astros |
3.72 |
1.02 |
.478 |
275.33
(275.33) |
120-
78 |
18
(18) |
10
(10) |
2.22
(2.38) |
.737 |
2.42 |
131 |
.592 |
2.03 |
265 |
4.46 |
198.0 |
|---|
| 137 |
Mordecai Brown |
1907
| Cubs |
2.46 |
1.00 |
.523 |
233.00
(243) |
116-
52 |
20
(17) |
6
(6) |
1.39
(1.65) |
.710 |
2.13 |
252 |
.604 |
2.32 |
135 |
4.45 |
193.5 |
|---|
| 138 |
Kyle Hendricks |
2016
| Cubs |
4.16 |
.93 |
.510 |
190.00
(188) |
110-
54 |
16
(16) |
8
(8) |
2.13
(2.56) |
.744 |
2.51 |
113 |
.587 |
1.91 |
357 |
4.41 |
235.0 |
|---|
| 139 |
Grover Alexander |
1916
| Phillies |
2.61 |
.92 |
.429 |
389.00
(388.33) |
152-
90 |
33
(33) |
12
(12) |
1.55
(1.78) |
.701 |
2.03 |
306 |
.606 |
2.38 |
117 |
4.41 |
211.5 |
|---|
| 140 |
David Price |
2012
| Rays |
4.08 |
.98 |
.547 |
211.00
(211) |
126-
62 |
20
(20) |
5
(5) |
2.56
(2.79) |
.685 |
1.85 |
439 |
.613 |
2.56 |
72 |
4.41 |
255.5 |
|---|
Top 150 Starting Pitcher Seasons, 1890-2024*. Min. ~4.40 StDevs over Avg.
| Rank |
Pitcher |
Year |
Team(s) |
LG
ERA |
DEF/
PFOPP |
OPP
WL |
IP
(as starter) |
Runs For-
Agst |
Won
(as starter) |
Lost
(as starter) |
ERA
(Adj. ERA) |
ERA Score |
# STDEV over Avg. |
ERA Rank (of 11,899) |
W-L Score |
# STDEV over Avg. |
W-L Rank (of 11,899) |
Total (ERA+
W-L STDEV) |
Avg. Rank) |
| 141 |
Roger Clemens |
2005
| Astros |
4.22 |
.97 |
.515 |
211.33
(211.34) |
84-
51 |
13
(13) |
8
(8) |
1.87
(2.31) |
.736 |
2.42 |
132 |
.590 |
2.00 |
286 |
4.41 |
209.0 |
|---|
| 142 |
Whitey Ford |
1964
| Yankees |
3.63 |
.98 |
.510 |
244.67
(241.66) |
109-
67 |
17
(17) |
6
(6) |
2.13
(2.11) |
.728 |
2.33 |
164 |
.593 |
2.07 |
251 |
4.40 |
207.5 |
|---|
| 143 |
Jacob deGrom |
2019
| Mets |
4.38 |
.92 |
.511 |
204.00
(204) |
92-
60 |
11
(11) |
8
(8) |
2.43
(2.43) |
.767 |
2.77 |
62 |
.575 |
1.63 |
681 |
4.40 |
371.5 |
|---|
| 144 |
Randy Johnson |
1999
| Diamondbacks |
4.57 |
.96 |
.503 |
271.67
(271.67) |
155-
87 |
17
(17) |
9
(9) |
2.63
(2.64) |
.737 |
2.43 |
129 |
.589 |
1.96 |
309 |
4.40 |
219.0 |
|---|
| 145 |
Dontrelle Willis |
2005
| Marlins |
4.22 |
.94 |
.516 |
236.33
(236.33) |
128-
74 |
22
(22) |
10
(10) |
2.06
(2.67) |
.721 |
2.25 |
194 |
.597 |
2.15 |
208 |
4.40 |
201.0 |
|---|
| 146 |
Allie Reynolds |
1952
| Yankees |
3.67 |
.95 |
.491 |
244.33
(235) |
115-
71 |
20
(20) |
8
(8) |
2.56
(2.28) |
.733 |
2.39 |
144 |
.591 |
2.01 |
277 |
4.40 |
210.5 |
|---|
| 147 |
Kevin Appier |
1993
| Royals |
4.32 |
1.06 |
.516 |
238.67
(238.67) |
119-
78 |
18
(18) |
8
(8) |
1.83
(2.72) |
.722 |
2.27 |
187 |
.595 |
2.12 |
216 |
4.39 |
201.5 |
|---|
| 148 |
Clayton Kershaw |
2013
| Dodgers |
3.73 |
.94 |
.485 |
236.00
(236) |
108-
56 |
16
(16) |
9
(9) |
2.53
(2.13) |
.742 |
2.48 |
117 |
.587 |
1.91 |
356 |
4.39 |
236.5 |
|---|
| 149 |
Max Scherzer |
2018
| Nationals |
4.02 |
1.06 |
.518 |
220.67
(220.67) |
139-
65 |
18
(18) |
7
(7) |
2.72
(2.58) |
.713 |
2.16 |
230 |
.600 |
2.23 |
183 |
4.39 |
206.5 |
|---|
| 150 |
Greg Maddux |
1996
| Braves |
4.21 |
1.02 |
.505 |
245.00
(245) |
111-
85 |
15
(15) |
11
(11) |
.00
(2.48) |
.760 |
2.69 |
74 |
.578 |
1.69 |
609 |
4.38 |
341.5 |
|---|
The 2020 season is an official season of Major League Baseball. In other cases of short seasons (1890s, 1918-19, 1981 and 1994), significantly fewer games than the long time norms of 154 or 162 were played for various reasons. Those seasons were all treated as 'full' in this analysis because the effects of skewing was minimal.
However, 2020 saw teams play ~45% fewer games, on average, than the next shortest season that is treated as a full season. This made it highly succeptible to the effects of skewing. Further, a minimum of 15 starts is one of the qualifications in this study. No starter in 2020 had 15 starts. For these reasons, 2020 seasons cannot be included among all other seasons, although several starters (including Shane Bieber, Trevor Bauer, and Yu Darvish) did quite well, relatively speaking. But, the scores for qualifying starters will still be used as part of each starter's career assessment since the season schedule was designed to be short and was played in its entirety.


